
CREATOR COMMERCE / ANALYTICS · ECOM RATINGS
Stan Store Conversion Tracking: What Its Analytics Can and Cannot Attribute
Independent editorial guide · Primary sources reviewed November 4, 2026

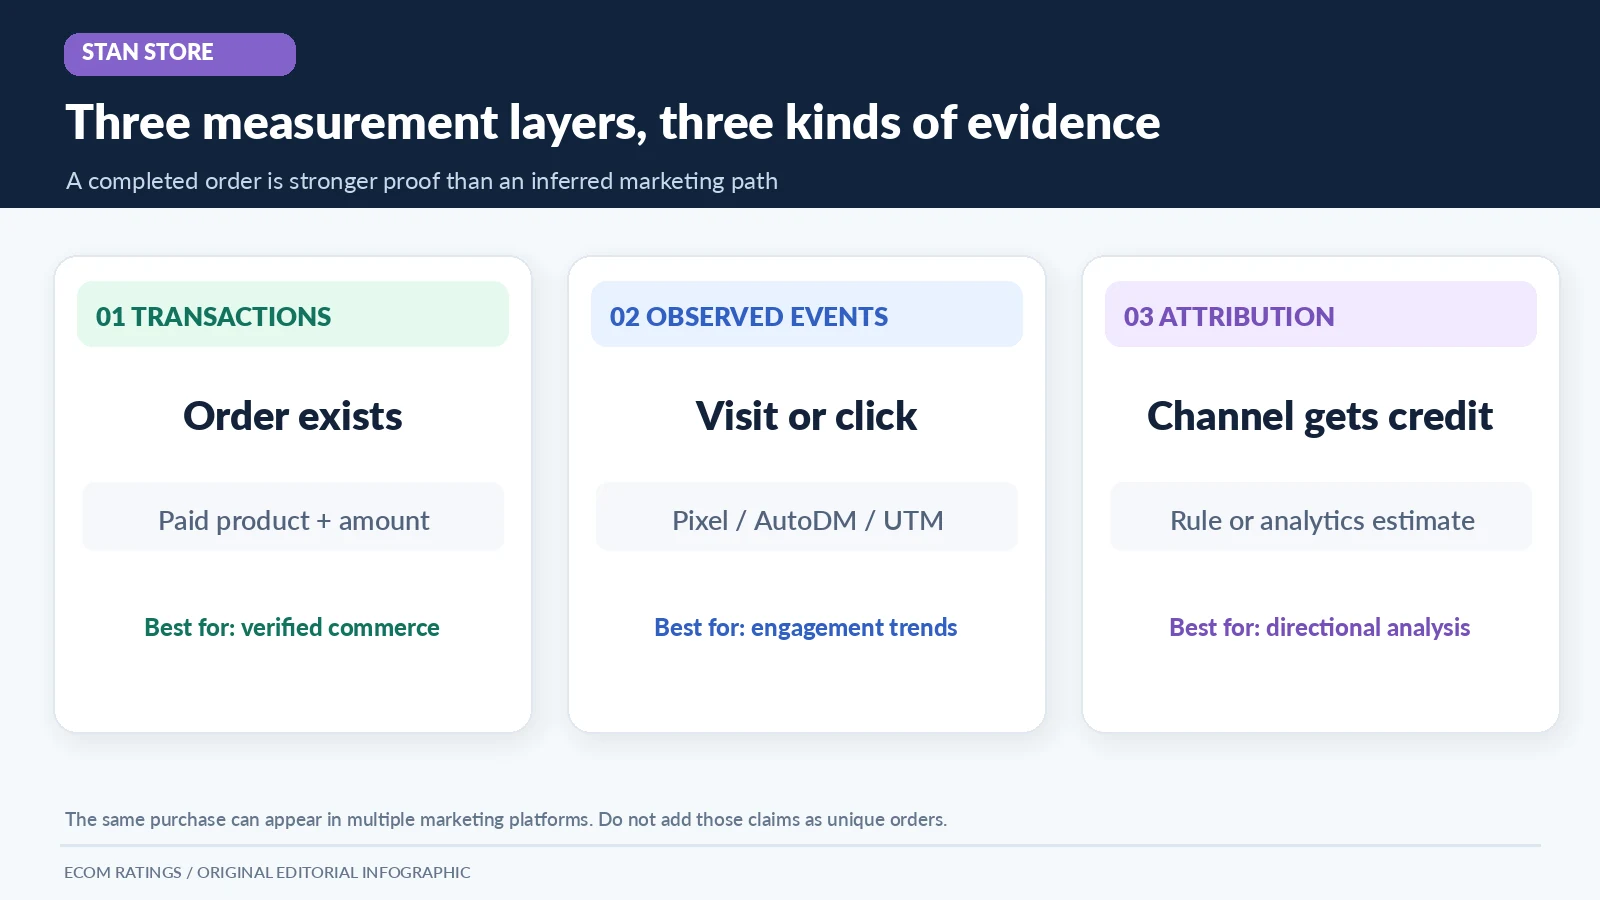
A creator can see more traffic to a Stan Store, receive purchases and still be unsure which post, link or campaign deserves credit. That uncertainty is not necessarily a reporting bug. Store performance measurement and marketing attribution answer different questions. The first asks what happened at the store. The second attempts to assign a purchase to an earlier interaction, often across several apps and devices.
Stan offers built-in store analytics, plus optional pixel and analytics integrations on its Creator Pro plan. Its official help materials discuss Google Analytics, Meta, TikTok and Pinterest integration, and separate analytics for AutoDM, emails and affiliate programs. Those tools can make the picture more useful. They do not automatically create a complete, person-level history of every impression, click and sale. This guide shows what evidence is available, what remains uncertain and how to design a defensible tracking workflow.
Start by separating store conversion from attribution
A store conversion describes a completed action on or through the selling experience: for example, a paid digital download order. Attribution is a claim about what caused or preceded that action. A store can record a completed purchase without knowing whether a person arrived because of a TikTok video, Instagram Story, forwarded link, newsletter or several different exposures over a week.
This distinction matters because creators often read a rise in revenue after publishing content as proof that the new content directly caused the increase. That may be plausible, but timing alone is not proof. Some customers visit repeatedly before buying. Some arrive through a social profile after seeing multiple posts. Others receive a direct link from a friend. Without reliable campaign identification and an explicit attribution model, the dashboard cannot reconstruct that whole history.
The practical goal should be better decisions, not a fictional level of certainty. Track observable store outcomes accurately. Use platform-specific signals where available. Label weaker attribution conclusions as estimates or correlations rather than as confirmed sales paths. That is a more credible way to decide which content and campaigns to improve.
What Stan confirms about its analytics stack
Stan’s help center says its Analytics tab provides insight into store traffic. It separately describes Creator Pro’s ability to connect Pixel IDs and analytics identifiers. The documented integrations include a Google Analytics ID, Meta Pixel, TikTok Pixel and Pinterest tag or claim identifier. These are not described as universally available to all plans: the integration article explicitly identifies the feature as Creator Pro.
The help center also provides feature-level reporting outside the main analytics view. AutoDM can report triggered messages, opens, link clicks and a metric it labels Opt-Ins for purchases from AutoDM. Affiliate Share has separate sales and affiliate-performance views. Email flows and broadcasts show delivered emails, opens and clicks. These reporting layers are useful, but they measure different stages of a journey and should not be merged into a single “verified conversion” number without careful definitions.
One common mistake is to assume a tool named “Analytics” implies event-level multi-touch attribution. The available product materials support a narrower, more precise conclusion: Stan exposes store-performance information and offers integrations that can enrich marketing analysis. The exact attribution depth of a specific account depends on plan, configuration, data quality, the external analytics provider and the path the buyer followed.
The Creator Pro pixel requirement matters
A creator planning to measure paid traffic should check the plan before building a campaign around pixel data. Stan’s official guide places Pixel IDs under Creator Pro, with fields available from the profile settings area. Its documented integrations cover Google Analytics, Meta, TikTok and Pinterest. Connecting a valid identifier allows supported user activity from Stan pages to be sent to the relevant external system.
That can enable additional reporting about page visits or purchase-related events, and it can support advertising optimization where the external platform recognizes eligible events. But the existence of a pixel ID does not prove that every event will be captured. The external account may have configuration issues. Browser privacy settings, consent conditions and ad blockers can interfere. A buyer might change devices or use an in-app browser that behaves differently from an ordinary web browser.
Therefore, a creator on the basic plan should not be told to expect Pro-only attribution tools, while a Creator Pro user should not be promised perfect tracking. For a precise answer, record the subscription plan, the connected identifier, the event visible in the external platform and the date of the test. This avoids treating a settings screenshot as evidence that purchases are being attributed correctly.
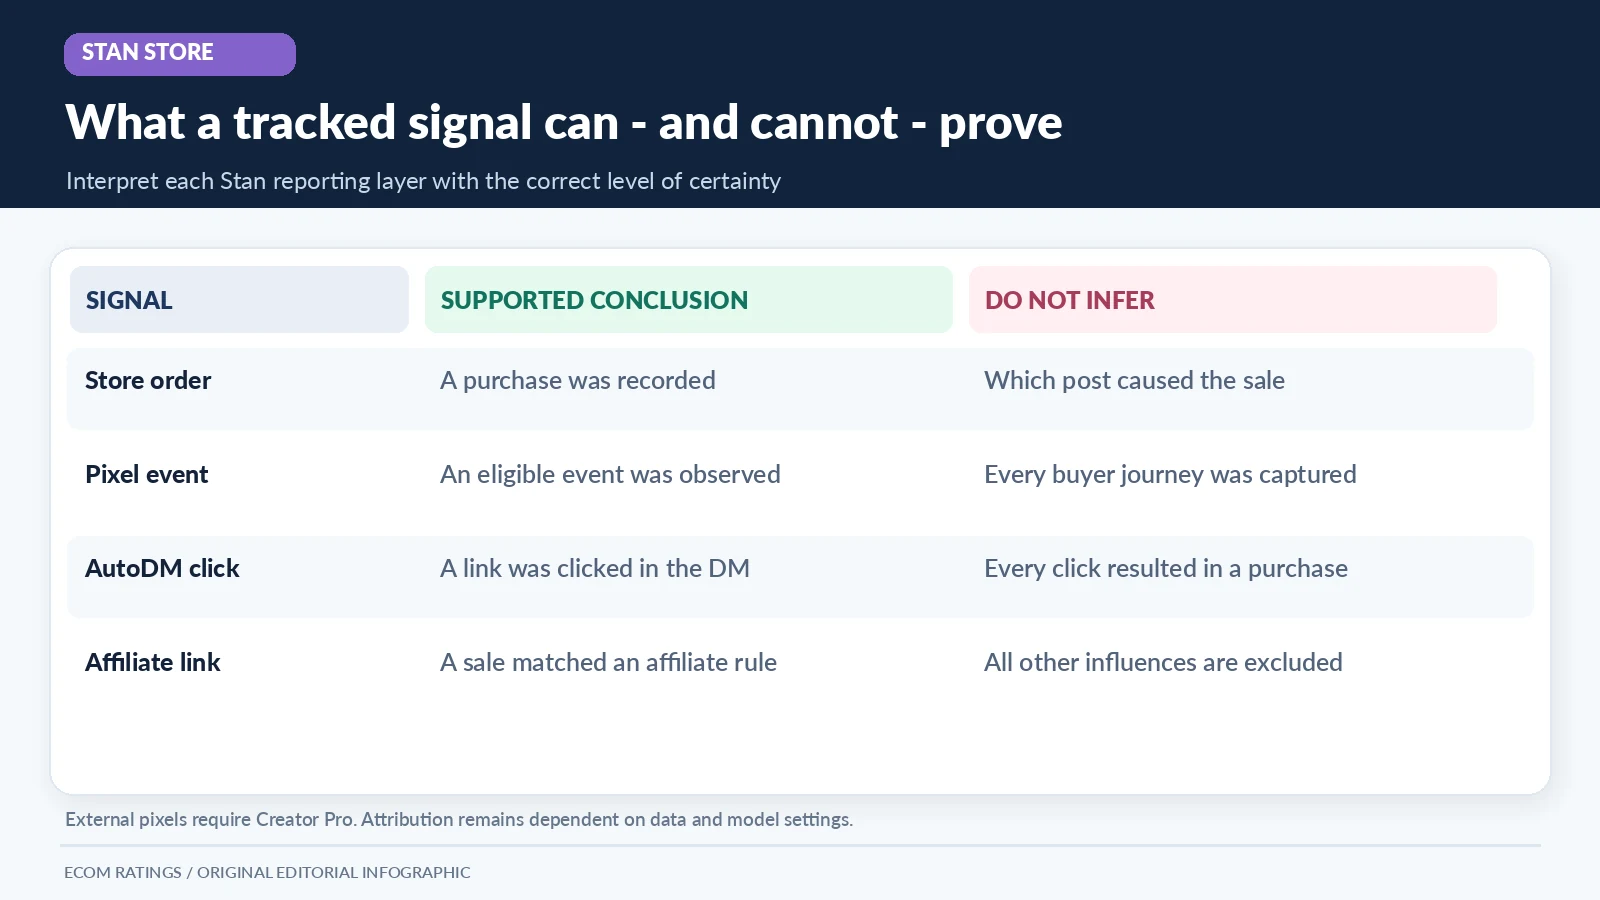
| Reporting layer | What it can help show | What it does not establish alone |
|---|---|---|
| Stan store analytics | Store traffic and performance indicators | Which specific social post caused an order |
| Income or order record | Completed purchase and payment details | The customer’s complete prior journey |
| Creator Pro pixel integration | Eligible events seen by the external analytics platform | A complete record of blocked or cross-device events |
| AutoDM reporting | Sends, opens, tracked link clicks and labeled purchase outcomes | Incremental revenue caused solely by the DM |
| Affiliate reporting | Transactions linked to specific affiliate mechanisms | All assisted sales outside tracked links |
| Email reporting | Delivery, opens and clicks for a campaign | Guaranteed open accuracy or final sale causality |
A worked example: 1,000 visits and 25 orders
Imagine a creator observes 1,000 store visits and 25 completed paid orders over a defined reporting period. If the platform’s visit definition is an appropriate denominator, the simplified order conversion calculation is 25 ÷ 1,000 × 100 = 2.5%. That calculation measures a period-level relationship between visits and orders. It says nothing by itself about whether TikTok, Instagram, email or referrals caused those orders.
Suppose the creator also records 400 visits on days with a TikTok push, 300 around an Instagram campaign and 300 in other periods. Those are not verified channel-specific sessions; they are only a rough temporal grouping. If the creator then assigns ten purchases to TikTok because ten orders occurred after TikTok posts, that would be an attribution assumption, not a demonstrated fact. The same customer may have seen both channels.
A stronger approach is to combine tagged links and connected analytics where supported, while preserving a separate total-order record as the financial reference. Even then, external platforms may disagree about conversion counts or dates. The honest report should show the difference rather than forcing every order into a neat single-source bucket.
Why an Instagram post is difficult to identify as the cause
Instagram journeys frequently involve profile links, Stories, direct messages and repeated visits. A person might watch a Reel, bookmark it, return two days later through the profile bio and then buy. The store may record the final visit, while the original Reel exposure lives in Instagram’s system. If a purchase occurs after multiple interactions, attribution depends on the chosen model and what event data survived the journey.
Similarly, a creator may run Meta ads while publishing unpaid posts. The Meta Pixel can help report eligible activity and conversions connected to the advertising account, but a platform-reported conversion is not automatically proof that the ad was the sole cause of the sale. View-through or click-through attribution windows, match quality and repeated exposure can all shape the report. These are general advertising measurement issues, not unique flaws in Stan.
For practical decisions, compare campaign periods, landing pages and trackable link groups while resisting the temptation to claim “this exact Reel made every sale.” A clear attribution caveat is especially important when using performance screenshots in sponsored or affiliate promotion. Readers deserve to know whether the number is a direct tracked event, a platform estimate or an inference made after the fact.
The AutoDM funnel has its own metrics
Stan’s AutoDM help article names four metrics: Sent, Opened, Clicks and Opt-Ins, with the latter defined in the article as purchases from AutoDM. This creates a useful funnel: a trigger produces an automated message; the recipient may open it; some recipients click; some tracked outcomes may register as purchases. Those stages help diagnose whether the bottleneck is message delivery, interest in the link or purchase completion.
The definitions also reveal a subtle limitation. The help article says external link clicks are counted even when the destination is not a Stan Store URL. A click on an outside site does not itself prove an order on that outside site. A creator should not take a general AutoDM clicks total and label it “Stan sales,” nor should they interpret all message opens as qualified buyers. The step name must be preserved when reporting performance.
Consider a campaign with 500 sent DMs, 350 opens, 70 clicks and six recorded Opt-Ins. The descriptive rates are 70% opens per sent, 20% clicks per open and about 8.6% Opt-Ins per click. All numbers here are invented for illustration. Even a clean funnel does not show whether some buyers would have purchased anyway, whether traffic was duplicated across channels or what happened to users who clicked through to an external destination.
Email attribution is another separate layer
Stan’s email analytics materials describe deliveries, opens, clicks, CTR and click-to-open metrics. These can help evaluate whether a message was received and whether it attracted interaction. But email opens are not a reliable person-level indicator of intent because privacy technologies can preload or mask open events. A delivery count is also not equivalent to inbox placement. It tells the sender about the system’s reported status, not that the message was read.
If a buyer clicks an email and purchases, the resulting attribution depends on the tracking arrangement. A creator should note whether the link carried campaign parameters, whether the external analytics system attributed a session to email and whether a matching sale was recorded. Do not assume that every sale on the same day as a broadcast came from the email. The strongest claim is the one grounded in specific event data and a documented attribution rule.
For a practical campaign report, place delivery engagement next to store orders in two columns rather than merging them prematurely. The email metrics describe reach and interaction. The store metrics describe commerce. Joining them accurately requires a reliable linking method and an awareness of privacy constraints. This approach keeps creative testing useful without overclaiming direct revenue impact.
Affiliate reporting can be clearer than general social attribution
Stan’s newer Affiliate Share workflow assigns unique links to affiliates, and its help materials describe affiliate-specific sales, commissions and pending or completed payouts. That is a more explicit attribution mechanism than guessing which social post generated a sale. When a qualified order is linked to a particular affiliate identifier, the platform has a defined rule for assigning commission or affiliate credit.
Even there, “affiliate-attributed” should not be confused with “all influence belongs to the affiliate.” Customers can discover a product through one source and purchase through another. Link sharing, private messages or previously saved pages can complicate attribution. The affiliate mechanism is primarily a commercial tracking rule for eligible transactions, not a comprehensive model of every marketing touchpoint.
When comparing affiliate results with paid ads or organic social, use comparable measures: number of eligible orders, gross revenue, refunded or canceled sales, and commission cost. Keep attribution definitions next to the numbers. Otherwise a supposedly rigorous channel comparison can become an apples-to-oranges exercise in which one source counts linked conversions and another counts estimated assisted conversions.
How to structure UTM parameters without making the report messy
UTM tags can help identify campaign source, medium and name in compatible analytics systems. A creator can use different tagged links for a newsletter, Instagram bio and one paid promotion. The goal is not to create hundreds of near-duplicate URLs, but to impose naming discipline so a future report can group visits reliably. Use consistent lower-case source names, campaign dates when useful and a stable naming convention.
For example, a campaign link might append utm_source=instagram&utm_medium=bio&utm_campaign=planner_launch. That is an illustration of standard URL parameters, not a claim that Stan’s own dashboard exposes every UTM field natively. The fields only help if the destination and analytics setup preserve and record them. If a social app strips parameters, the user changes devices or a tracking system is blocked, the source can be lost.
Avoid storing personally identifying information in UTM values. Do not put customer emails or names into campaign parameters simply to “improve attribution.” Such parameters can leak into referrer logs and analytics systems. A good naming system describes campaigns, not individual people. It should be tested with a sample visit before a promotion goes live.
A practical validation sequence for creators
Start with a baseline: record visits and completed purchases over a consistent date range, plus product price, any discounts and refunds. Next check the Stan plan and confirm whether Creator Pro pixel features are available. If pixels are used, verify that the identifiers belong to the right external account and perform a controlled page-view test. Then test a real or sandbox purchase only through a permitted method so the creator can observe which events appear where.
Test separately on desktop and a mobile in-app browser when that reflects normal customer behavior. Record time zones for Stan, GA4 and advertising platforms, since different reporting-day boundaries can create apparent discrepancies. Check whether conversion currency and gross versus net revenue definitions match. Do not expect a payment processor’s net payout to equal a store’s gross order total after fees, discounts and refunds.
Finally, compare the same transaction across systems using a permitted order reference or timestamp without exposing private customer data. If the order is visible in Stan but absent in an ad platform, do not change financial records to force a match. Classify the discrepancy as a measurement or attribution question until the reason is understood. This keeps the transaction ledger authoritative while improving marketing reports incrementally.
The dashboard reconciliation worksheet
A useful weekly worksheet has separate fields for store visits, completed orders, gross order value, refunds, net revenue after recorded adjustments, tracked ad-platform conversions, AutoDM outcomes, email clicks and affiliate-linked sales. Add the definitions and time zone used for each metric. This makes source limitations visible. One sale may appear in multiple marketing reports; it should still appear once in the underlying financial order ledger.
When two advertising platforms both claim a conversion, consider overlap rather than adding their reported figures together. If Meta reports eight conversions and TikTok reports five, it does not follow that thirteen distinct purchases occurred. Some of those events may represent the same customer or order. Compare platform-reported conversions with the number of verified store orders and label any overlap unresolved until the event data can support a clearer conclusion.
This distinction is useful for budget decisions. Creators need not prove the causal role of every individual view to improve content. They do need to know whether a rising ad spend is associated with additional verified orders at a sustainable cost. A disciplined report can make that decision without pretending that browser and platform privacy constraints do not exist.
What Stan can and cannot tell you in plain language
Stan can help creators understand store performance and, with appropriate integrations and feature-specific reporting, observe parts of the path that lead to a sale. The tools are meaningful: a Creator Pro user can connect common analytics services, and AutoDM, email and affiliate features provide their own operational metrics. That is a useful measurement stack for a compact creator business.
The limit is the completeness of attribution. No standard store dashboard can reconstruct every off-platform view, private share, device change, blocked event and untagged journey with certainty. An honest article therefore avoids both extremes: it should not claim Stan “tracks nothing,” and it should not say it can identify the exact content that caused every conversion. Each statement should be tied to the specific event or report that supports it.
The right operational takeaway is simple: use store transactions for the financial outcome, tagged links and external analytics for directional marketing insight, and product-specific tools for their defined engagement stages. Whenever the reports disagree, preserve the disagreement and investigate rather than inventing a neat explanation. That produces better decisions, more trustworthy reporting and a clearer understanding of what Stan Store analytics actually measures.
Compare this guide with the independent Stan Store review for broader pricing and feature context.
Primary sources and verification
- Stan Help Center: How Do I Add Pixel IDs for Analytics?
- Stan Help Center: Creator Pro Features
- Stan Help Center: How to Set Up Stan AutoDM
- Stan Help Center: How to Track Your Affiliate Sales
- Stan Help Center: Email Flows and Broadcasts Analytics
- Stan Help Center: Store Analytics Collection