
What a daily risk limit measures, why an overall loss limit is a different rule, and how to calculate both without confusing the One Phase, Two Phase and Instant Funding programs.
Documentation-based research · Verified November 2, 2026

The short answer: two limits can be breached independently
A trader can finish a day with a positive-looking account balance and still fail a challenge because intraday equity fell below the permitted daily threshold. Another trader can stay inside every single-day loss allowance but accumulate enough losses across several sessions to breach the overall maximum. These are two separate risk tests. Max Daily Loss limits exposure within a trading day. Max Total Loss sets the broader account-level boundary. Neither substitutes for the other, and the more restrictive test can become decisive first.
Funded7’s published challenge comparison shows different percentage limits by program. The standard Two Phase evaluation lists 5% daily loss and 10% maximum total loss, with a static total-loss mechanism. One Phase lists 4% daily and 8% total, with a trailing total-loss mechanism. Instant Funding lists 5% daily and 8% total, also trailing. The comparison contains additional programs such as PAYG and Two Phase NEO; therefore no reader should assume one set of figures describes every offer.
The practical information gap is not the percentages, which are visible on the provider’s site. It is the mechanics behind them: the measurement base, the daily reset, the difference between balance and equity, and the way a high-water mark can move an overall threshold. The worked examples below are arithmetic demonstrations of published rule concepts, not a simulation of a real funded account or a claim that a specific trader passed.
First identify the exact challenge before doing any math
| Program | Daily loss | Total loss | Type |
|---|---|---|---|
| Two Phase | 5% | 10% | Static |
| One Phase | 4% | 8% | Trailing |
| Instant Funding | 5% | 8% | Trailing |
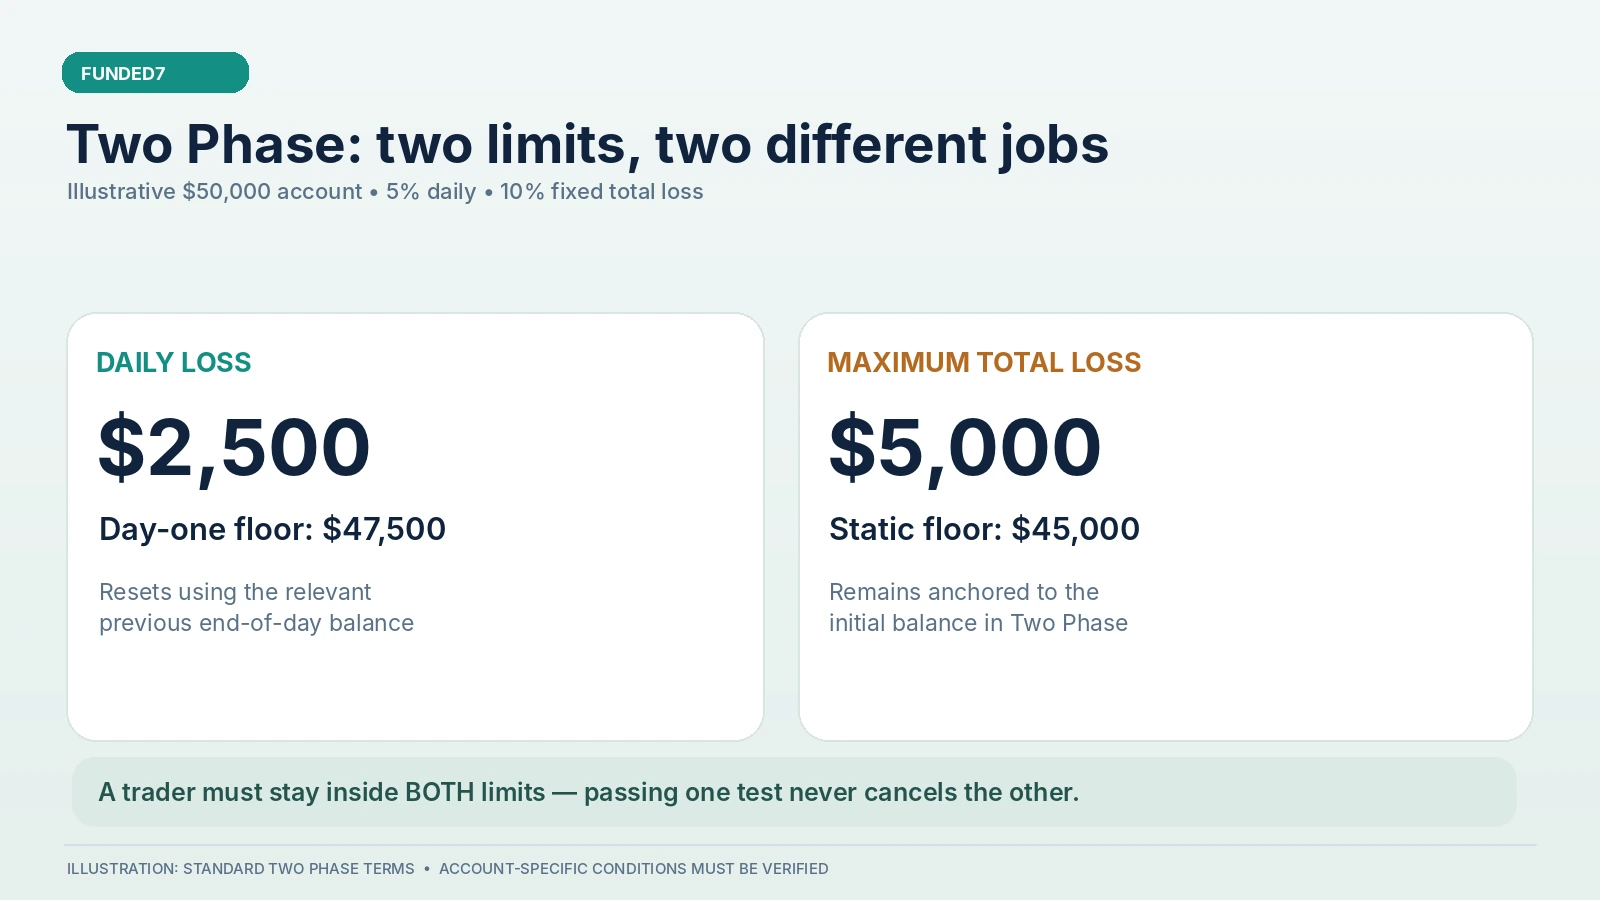
For a standard $50,000 Two Phase example, 5% is $2,500 and 10% is $5,000. That does not mean a trader may lose $2,500 every day indefinitely. Five percent is the daily boundary for the relevant reset period; the overall floor still constrains the accumulated result. After successive losing sessions, the total-loss test can be reached even when each day remains individually within its daily allowance. Two independent thresholds operate simultaneously.
There is an additional documentary nuance. Funded7’s daily-loss explanation says the daily figure is recalculated as a percentage of the previous day’s end-of-day balance. Some other promotional writing summarizes daily rules more loosely. Because challenge terms can vary or be updated, the operational rule displayed for the specific live account should control the trader’s final decision. This guide uses the explicit previous-day-balance methodology for the daily examples and flags where the current account’s reset conventions need confirmation.
Balance versus equity: why an open trade matters
Balance generally reflects realized cash effects from closed trades and recorded transactions. Equity reflects the account’s current value after incorporating the unrealized profit or loss of open positions. Imagine a trading account whose realized balance is still $50,000. The trader opens a position and the market moves against it, creating an unrealized loss of $2,600. Equity is now about $47,400 even though the displayed balance from closed trades remains at $50,000. If the relevant daily breach floor is $47,500, the account has crossed it before the loss is closed.
This is the central reason a daily-limit worksheet should monitor equity, not just closed P/L. Funded7’s published daily-loss examples label their minimum threshold as “Minimum Equity Before Breach” and describe the challenge as failed when equity falls beneath the floor. A trader who waits for a stop-loss order to close a position may discover that floating losses already passed the boundary. Slippage, spreads, commissions and overnight charges can also affect the running account value, depending on the platform’s accounting.
For careful risk management, the trader should know the starting benchmark, the floor in account currency, the current equity and the gap between equity and that floor. That last gap is a more useful operational number than the percentage alone. It tells a trader how much room remains before a further adverse move becomes a rule breach, subject to the platform’s own calculation and breach condition.
Worked example 1: a $50,000 Two Phase day
Take a standard Two Phase account beginning the session with a $50,000 benchmark and a 5% daily cap. Five percent of $50,000 is $2,500. Under the previous-end-of-day approach, a simple day-one floor is $50,000 minus $2,500, or $47,500. If current equity is $49,100 after trades, the trader is $1,600 above the daily floor. At $47,800, the remaining buffer is only $300. At $47,400, the example crosses the daily floor and constitutes a breach.
Now look at the same account’s static 10% overall loss limit. Ten percent of the initial $50,000 is $5,000, giving a permanent model floor of $45,000 for the relevant Two Phase example. The first day therefore has two different floors: $47,500 under the daily test and $45,000 under the static total test. The trader cannot reason that the deeper total-loss floor makes the daily floor optional. Reaching $47,400 would fail the daily test despite remaining far above $45,000.
Also notice that the numerical gap between the two floors is not a separate daily allowance. If the equity drops to $47,400 and then rallies before the session closes, the intraday breach may already have occurred. A risk rule measured during the day is not repaired merely because the closing balance looks healthy. For real trading, check how the evaluation dashboard detects and records breaches and whether it treats touching a floor or only passing beneath it as the trigger.
Worked example 2: the next-day daily floor changes
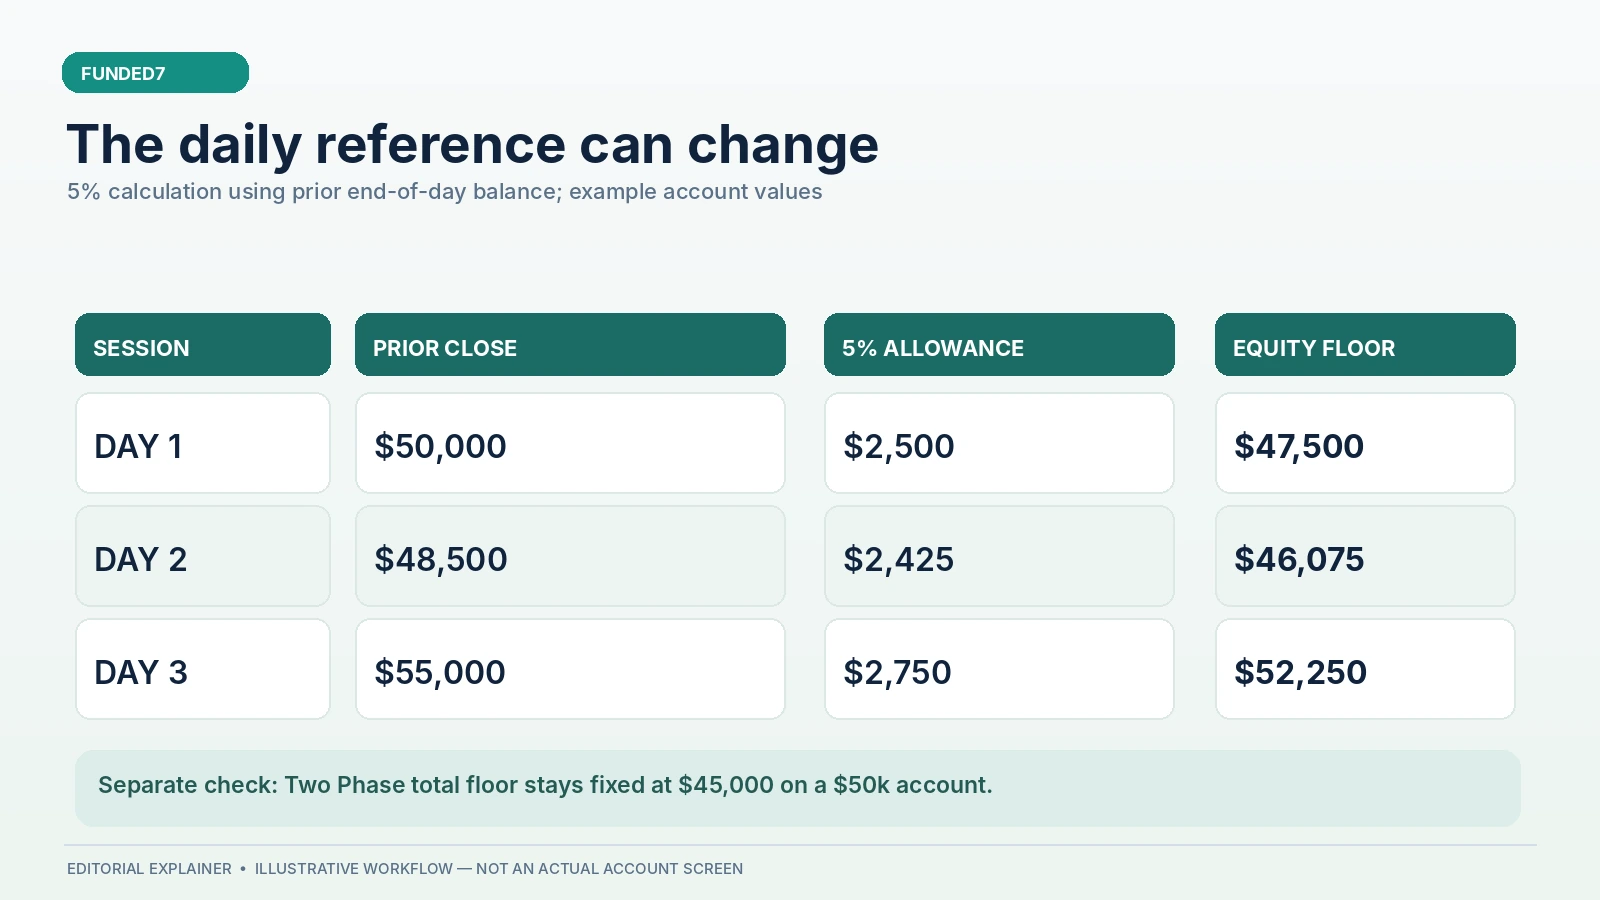
Funded7’s detailed daily-loss FAQ uses the previous day’s end-of-day balance. Suppose the $50,000 account ends Monday with a realized balance of $48,500. At the new trading-day reset, a 5% daily allowance on $48,500 equals $2,425. The new illustrative minimum equity is $46,075. This differs from simply carrying forward the original $47,500 threshold. It is why copying yesterday’s daily line into today’s notebook without recalculating can be misleading.
Conversely, suppose an account ends a later day with a balance of $55,000. Five percent becomes $2,750, and the daily minimum equity for that new session is $52,250. The nominal dollar allowance has increased because the reference balance is higher. That does not automatically change the static overall threshold of a Two Phase program; the daily and total calculations still derive from different rules.
The important timing question is when the provider captures the closing balance. The published Funded7 FAQ describes the trading day as running from 17:00 to 17:00 Eastern Standard Time, alongside a platform-server reset reference. Time zone labels around daylight-saving changes can become confusing, so check the actual server time or account-dashboard reset rather than assuming a local midnight. If you trade across that boundary, an open position may be assessed against a freshly calculated daily floor even though it was opened during the previous session.
Worked example 3: several moderate losses can breach the total limit
Consider a $50,000 Two Phase account with the static overall floor at $45,000. On Day 1, the trader closes at $48,700, a realized decline of $1,300. On Day 2, the account falls another $1,400 to $47,300. Day 3 closes with a further $1,300 loss at $46,000. Each day can be below the current daily percentage allowance depending on its benchmark and intraday equity, yet the total loss now equals $4,000. Only $1,000 remains above the static overall floor.
Suppose Day 4 begins at $46,000. A 5% daily allowance on the prior close is $2,300, producing a daily floor of $43,700. But the static overall floor is still $45,000, which is higher and therefore becomes the binding limit first. The account cannot safely use the entire $2,300 daily amount: only $1,000 of overall room remains before reaching $45,000. This is a classic example of a trader being “within the daily rule” yet failing the challenge on total loss.
The operational worksheet should therefore track two remaining buffers every time a position is opened: equity minus today’s daily floor, and equity minus the maximum-total-loss floor. The smaller positive number determines which constraint is nearer. A disciplined trader also keeps a substantial safety margin rather than deliberately targeting the threshold, because spreads and execution differences can consume remaining headroom faster than expected.
Static versus trailing maximum loss: a separate type of rule
Funded7’s current comparison identifies Two Phase, PAYG and Two Phase NEO as static for total loss, while One Phase and Instant Funding use trailing total loss. Static means the total-loss floor is calculated from the initial challenge balance and does not climb merely because profits were made. On a $50,000 Two Phase account with 10% max total loss, that illustrative floor remains $45,000 even after the balance grows to $54,000. The trader has more distance from the floor after earning profit, but the floor itself remains fixed.
Trailing rules behave differently. The provider’s FAQ describes a high-water-mark mechanism that raises the allowable minimum equity as the account achieves new peaks, and discusses a lock at the starting balance and recalculations following withdrawals. Those details are material. A trader can have a profitable month and still face a higher failure floor than at the beginning. A setback from a peak can therefore consume permitted room faster than someone looking only at the original entry balance might expect.
Do not reuse the 10% static example as a trailing-example formula. The One Phase and Instant Funding percentages differ in the published comparison, and the precise trailing calculation should be taken from the current program’s terms. The following simplified scenario uses an 8% starting limit solely to explain the basic high-water-mark idea, before any withdrawal or plan-specific adjustment.
Worked example 4: an 8% trailing maximum on $50,000
Imagine a $50,000 program with an 8% total-loss allowance, represented here by a $4,000 initial distance. Initially, the illustrative minimum equity is $46,000. The trader then raises the reference high-water mark to $53,000. With a $4,000 distance, the model floor moves to $49,000. That is an increase of $3,000 in the required minimum equity even though the starting capital has not changed.
Now imagine the account reaches a high-water mark of $54,000. The model floor becomes $50,000, equal to the initial balance. Under Funded7’s documented locking concept, further increases may be capped at that lock. A trader should not assume that the floor continues moving indefinitely in exactly the same way after the lock, or that a withdrawal leaves it unchanged. The FAQ discusses withdrawals and high-water marks separately; those require plan-specific review.
This calculation illustrates why a losing streak following strong profits can still breach a trailing rule. A trader may believe that they are “up from the start,” but what matters is how far current equity has fallen below the adjusted threshold. Because the published FAQ includes multiple examples with changing peaks and withdrawals, anyone intending to trade at significant size should check the live platform’s current floor, rather than reverse-engineering every case from a short article.
Worked example 5: floating loss breaches first
Take the earlier Two Phase example with a current daily floor of $47,500 and an overall floor of $45,000. The account has no closed loss yet. An open trade initially shows a floating loss of $1,300, leaving equity at $48,700 and a daily buffer of $1,200. The market then gaps another $1,400 against the position. Equity becomes $47,300. The realized balance still reads $50,000, but the equity-based daily minimum has been crossed.
This scenario explains why checking only the trade-history report can be misleading. A trader might say, “I have not closed a losing position, so I have not hit my daily loss.” The actual risk test may have been triggered by intraday equity. Furthermore, two simultaneous positions that appear independent can produce correlated losses during volatile news, so a combined account-level view is more important than examining each position in isolation.
The practical response is not to hunt for a platform loophole. It is to estimate worst-case account-level equity before placing a trade. A buffer should account for existing floating P/L, spread widening, commissions, swaps, and possible slippage. Keeping an internal stop level above the provider’s hard floor reduces the chance that a small execution difference becomes an immediate termination event.
Time resets, withdrawals and the dashboard: three verification points
First, identify the reset time displayed by the funded platform. An article using a fixed clock offset can become wrong when local time zones move. Funded7’s FAQ supplies both an Eastern-time convention and a server-time convention; for operational use, the platform’s displayed reset should be your primary clock. Capture that reference in your risk worksheet so that overnight positions are monitored against the correct session boundary.
Second, distinguish a withdrawal from an ordinary trading loss. For trailing max-loss programs, the Funded7 total-loss FAQ discusses how withdrawals change the high-water mark and adjusted floor. The effect cannot be safely inferred solely from “8% of the initial balance.” If you are planning a payout, work through a post-withdrawal example using the currently displayed account terms and verify the resulting permitted equity before committing to a new position.
Third, keep records of the rule version. Program pages, promotional conditions and FAQs can change. Save the plan name, account size, selected add-ons, the published loss percentages, and a timestamped screenshot of the platform’s risk metrics. This protects against accidental reuse of a model that belongs to a different program and helps support identify the exact calculation if a disputed breach is reviewed.
A practical risk worksheet for traders
A simple daily worksheet needs only a handful of columns: challenge type, starting balance, previous end-of-day balance, current-day loss percentage, calculated daily floor, static or trailing total floor, current equity, daily buffer, total buffer and next reset time. Update it when the new day begins and whenever the reference for a trailing floor changes. Avoid copying an old percentage table into every challenge without checking which model applies.
For a standard $50,000 Two Phase example, the initial row might read: daily percentage 5%, previous balance $50,000, daily floor $47,500; maximum percentage 10%, fixed total floor $45,000. After the previous close drops to $48,500, the daily floor changes to $46,075 while the total floor stays $45,000. If current equity is $46,600, the daily buffer is $525 and the overall buffer is $1,600. The daily limit is the nearer constraint.
That worksheet converts percentages into decisions. It encourages traders to think about remaining room, not only the nominal account size. If one number is close to zero, trading smaller or stopping may be the more rational choice. Funded7’s challenge rules establish a controlled evaluation environment; the trader’s independent job is to translate those rules into conservative position sizing and evidence-based recordkeeping.
Bottom line: calculate both limits before each session
Daily drawdown and maximum total loss answer different questions. The daily boundary determines how much the account can decline within a trading period using the applicable session reference; the overall boundary limits accumulated loss and can be static or trailing. Funded7’s Two Phase program is a useful demonstration because its 5% daily and 10% static total limits make the two tests easy to separate. One Phase and Instant Funding add the extra complexity of trailing loss floors.
Use the provider’s actual account rules, not a generic prop-trading slogan. Monitor equity as well as realized balance. Recalculate the daily floor when the reference day changes. Maintain the static or trailing total floor in a separate column, and treat the smaller buffer as the immediate binding constraint. Most of all, avoid assuming that a single green number in a dashboard proves every risk rule is satisfied. The value of a worked example is that it makes two simultaneous controls visible.
Primary sources and methodology
- Funded7: challenge comparison and current percentages
- Funded7: detailed daily loss calculation
- Funded7: maximum total loss calculation
- Funded7: Two Phase challenge details
- Funded7: Terms and Conditions
Worked account balances, equity paths and risk buffers are mathematical illustrations, not the performance of a real account. Where Funded7’s explanatory documents differ in granularity, this article distinguishes the explicit daily-loss FAQ, program comparison and trailing-loss FAQ rather than assuming all mechanisms are identical. Verify the rules shown for the purchased challenge.